Difference between revisions of "Ocean-Wave Spectra"
m (→JONSWAP Spectrum: Why substitute x for F?? F is a variable just like x.) |
|||
| (45 intermediate revisions by 5 users not shown) | |||
| Line 1: | Line 1: | ||
| − | = Introduction = | + | == Introduction == |
Ocean waves are produced by the wind. The faster the wind, the longer the wind blows, and the bigger the area over which the wind blows, the bigger the waves. In designing ships or offshore structures we wish to know the biggest waves produced by a given wind speed. Suppose the wind blows at 20m/s for many days over a large area of the North Atlantic. What will be the spectrum of ocean waves at the downwind side of the area? | Ocean waves are produced by the wind. The faster the wind, the longer the wind blows, and the bigger the area over which the wind blows, the bigger the waves. In designing ships or offshore structures we wish to know the biggest waves produced by a given wind speed. Suppose the wind blows at 20m/s for many days over a large area of the North Atlantic. What will be the spectrum of ocean waves at the downwind side of the area? | ||
| − | = Pierson-Moskowitz Spectrum = | + | It is important to realise that the spectra presented in the section are attempts to describe the ocean wave spectra |
| − | Various idealized spectra are used to answer the question in oceanography and ocean engineering. Perhaps the simplest is that proposed by Pierson and Moskowitz | + | in very special conditions, namely the conditions after a wind with constant velocity has been blowing for a long |
| + | time. A typical ocean wave spectrum wil be much more complicated and variable. For example it may have two | ||
| + | peaks, one from distance swell and the other generated by the local wind. | ||
| + | |||
| + | The concept of a wave spectrum can be quite abstract and is described in [[Waves and the Concept of a Wave Spectrum]] | ||
| + | |||
| + | == Pierson-Moskowitz Spectrum == | ||
| + | Various idealized spectra are used to answer the question in oceanography and ocean engineering. Perhaps the simplest is that proposed by [[Pierson and Moskowitz 1964]]. They assumed that if the wind blew steadily for a long time over a large area, the waves would come into equilibrium with the wind. This is the concept of a '''fully developed sea''' (a sea produced by winds blowing steadily over hundreds of miles for several days).Here, a long time is roughly ten-thousand wave periods, and a "large area" is roughly five-thousand wave-lengths on a side. | ||
<center> | <center> | ||
[[Image:Fig16-7s.jpg]] | [[Image:Fig16-7s.jpg]] | ||
</center> | </center> | ||
<center> | <center> | ||
| − | Figure | + | Figure 1 Wave spectra of a fully developed sea for different wind speeds according to [[Moskowitz 1964]]. |
</center> | </center> | ||
| − | To obtain a spectrum of a fully developed sea, they used measurements of waves made by accelerometers on British weather ships in the North Atlantic. First, they selected wave data for times when the wind had blown steadily for long times over large areas of the North Atlantic. Then they calculated the wave spectra for various wind speeds, and they found that the spectra were of the form (Figure | + | To obtain a spectrum of a fully developed sea, they used measurements of waves made by accelerometers on British weather ships in the North Atlantic. First, they selected wave data for times when the wind had blown steadily for long times over large areas of the North Atlantic. Then they calculated the wave spectra for various wind speeds, and they found that the spectra were of the form (Figure 1): |
<center> | <center> | ||
| − | <math>S(\omega) = \frac{\alpha g^2}{\omega^5}\exp\left(-\beta\left(\frac{\omega_0}{\omega}\right)^4\right)</math> | + | <math> S(\omega) = \frac{\alpha g^2}{\omega^5}\exp\left(-\beta\left(\frac{\omega_0}{\omega}\right)^4\right) </math> |
</center> | </center> | ||
| − | where <math>\omega = 2 | + | where <math> \omega = 2\pi f</math>, <math>f</math> is the wave frequency in Hertz, <math> \alpha = 8.1\times 10^{-3}</math>, <math> \beta = 0.74 </math>, <math>\omega_0 = g / U_{19.5}</math> and <math>U_{19.5}</math> is the wind speed at a height of 19.5m above the sea surface, the height of the anemometers on the weather ships used by [[Pierson and Moskowitz 1964]]. |
For most air flow over the sea the atmospheric boundary layer has nearly neutral stability, and | For most air flow over the sea the atmospheric boundary layer has nearly neutral stability, and | ||
<center> | <center> | ||
| − | <math>U_{19.5}\ | + | <math>U_{19.5}\approx 1.026 U_{10}</math> |
</center> | </center> | ||
| − | assuming a drag coefficient of <math>1.3\ | + | assuming a drag coefficient of <math> 1.3 \times 10^{-3}</math>. |
| − | The frequency of the peak of the Pierson-Moskowitz spectrum is calculated by solving <math>dS / d\omega = 0</math> for <math> | + | The frequency of the peak of the Pierson-Moskowitz spectrum is calculated by solving <math>dS / d\omega = 0</math> for <math>\omega_p</math>, to obtain |
<center> | <center> | ||
| − | <math>\omega_p | + | <math>\omega_p = 0.877 g / U_{19.5}\,\!</math> |
</center> | </center> | ||
| Line 41: | Line 48: | ||
The significant wave-height is calculated from the integral of <math>S\mbox{ }(\omega)</math> to obtain: | The significant wave-height is calculated from the integral of <math>S\mbox{ }(\omega)</math> to obtain: | ||
| − | <center><math>\left \langle \zeta^2\right \rangle=\int_{0}^{\infty}S(\omega)\mbox{ }d\omega=2.74 \times 10^{-3}\frac{(U_{10.5})^4}{g^2}</math></center> | + | <center> |
| + | <math>\left \langle \zeta^2\right \rangle=\int_{0}^{\infty}S(\omega)\mbox{ }\mathrm{d}\omega=2.74 \times 10^{-3}\frac{(U_{10.5})^4}{g^2}</math> | ||
| + | </center> | ||
Remembering that <math>H_{1/3} = 4\mbox{ }<\mbox{ }\zeta^2 \mbox{ }>\mbox{ }^{1/2}</math>, the significant wave-height calculated from the Pierson-Moskowitz spectrum is: | Remembering that <math>H_{1/3} = 4\mbox{ }<\mbox{ }\zeta^2 \mbox{ }>\mbox{ }^{1/2}</math>, the significant wave-height calculated from the Pierson-Moskowitz spectrum is: | ||
| − | <center><math>H_{1/3}=0.21\frac{(U_{19.5})^2}{g}\approx0.22\frac{(U_{10})^2}{g}</math></center> | + | <center> |
| + | <math>H_{1/3}=0.21\frac{(U_{19.5})^2}{g}\approx0.22\frac{(U_{10})^2}{g}</math> | ||
| + | </center> | ||
| + | |||
| + | Practical wave analysis of uses the frequency, <math> f </math>, instead of the angular frequency <math> \omega </math>. If we have a frequency spectrum, <math> S(\omega) </math>, then the corresponding frequency spectrum, <math> S'(f) </math>, will be | ||
| + | |||
| + | <center><math> S'(f) = S(2\pi f) \frac{\mathrm{d}\omega}{\mathrm{d}f} = 2\pi S(2\pi f) </math></center> | ||
| + | (the factor of <math> 2\pi </math> insures that the area under the curve remains the same). | ||
| + | |||
| + | In the following we omit the ' symbol. For practical reasons, it has also become standard to relate the variables to the main sea state parameters rather than wind speed, and to use slightly different values | ||
| + | so that the Pierson-Moskowitz spectrum can be expressed as | ||
| + | |||
| + | <center> | ||
| + | <math> | ||
| + | S(f) = \alpha g^2(2\pi)^{-4}f^{-5}\exp\left(-\frac{5}{4}\left(\frac{f_m}{f}\right)^4\right) | ||
| + | </math> | ||
| + | </center> | ||
| + | where <math> \alpha </math> is Phillips constant and <math> f_m </math> is the peak frequency. Remember that | ||
| + | these expressions are an approximation to the real sea spectrum. | ||
| − | Figure | + | Figure 2 gives significant wave-heights and periods calculated from the Pierson-Moskowitz spectrum. |
<center> | <center> | ||
| Line 53: | Line 80: | ||
</center> | </center> | ||
<center> | <center> | ||
| − | Figure | + | Figure 2 Significant wave-height and period at the peak of the spectrum of a fully developed sea calculated from the Pierson-Moskowitz spectrum. |
</center> | </center> | ||
| + | |||
| + | == JONSWAP Spectrum == | ||
| + | [[Hasselmann et al. 1973]], after analyzing data collected during the Joint North Sea Wave Observation Project JONSWAP, found that the wave spectrum is never fully developed. It continues to develop through non-linear, wave-wave interactions even for very long times and distances. Hence an extra and somewhat artificial factor was added to the Pierson-Moskowitz spectrum in order to improve the fit to their measurements. The JONSWAP spectrum is thus a Pierson-Moskowitz spectrum multiplied by an extra peak enhancement factor | ||
| + | <math> \gamma^r </math> | ||
| + | |||
| + | <center><math>S_j(\omega)=\frac{\alpha g^2}{\omega^5}\exp\left[-\frac{5}{4}\left(\frac{\omega_p}{\omega}\right)^4\right]\gamma^r</math></center> | ||
| + | |||
| + | <center><math>r=\exp\left[-\frac{(\omega-\omega_p)^2}{2\sigma^2\omega_p^2}\right]</math></center> | ||
<center> | <center> | ||
| Line 60: | Line 95: | ||
</center> | </center> | ||
<center> | <center> | ||
| − | Figure | + | Figure 3 Wave spectra of a developing sea for different fetches according to [[Hasselmann et al. 1973]]. |
</center> | </center> | ||
| − | + | Figure 3 show wave spectra as mearured from {[Hasselmann et al. 1973]] and Figure 4 shows a comparison | |
| − | Hasselmann et al. | + | of the JONSWAP and Pierson-Moskowitz spectra. |
| − | + | <center> | |
| − | <center> | + | [[Image:SpSj.jpg]] |
| − | + | </center> | |
| − | <center> | + | <center> |
| + | Figure 4 The JONSWAP and Pierson-Moskowitz spectra. | ||
| + | </center> | ||
| − | Wave data collected during the JONSWAP experiment were used to determine the values for the constants in | + | Wave data collected during the JONSWAP experiment were used to determine the values for the constants in the |
| + | above equations: | ||
| − | + | ::::::::::::<math>\alpha=0.076\left(\frac{U_{10}^2}{F\mbox{ }g}\right)^{0.22}</math> | |
| − | + | ::::::::::::<math>\omega_p=22\left(\frac{g^2}{U_{10}F}\right)^{1/3}</math> | |
| − | + | ::::::::::::<math>\gamma = 3.3 \,\!</math> | |
| − | + | ::::::::::::<math> \sigma = \begin{cases} 0.07 & \omega \le \omega_p \\ 0.09 & \omega > \omega_p \end{cases} </math> | |
| − | where F is the distance from a lee shore, called the fetch, or the distance over which the wind blows with constant velocity. | + | where <math>F</math> is the distance from a lee shore, called the fetch, or the distance over which the wind blows with constant velocity. |
The energy of the waves increases with fetch: | The energy of the waves increases with fetch: | ||
| − | <center><math>\left \langle \zeta^2\right \rangle =1.67 \ | + | <center><math>\left \langle \zeta^2\right \rangle =1.67 \times 10^{-7} \frac{(U_{10})^2}{g}F.</math></center> |
| + | |||
| + | The JONSWAP spectrum is similar to the Pierson-Moskowitz spectrum except that waves continues to grow with distance (or time) as specified by the a term, and the peak in the spectrum is more pronounced, as specified by the g term. The latter turns out to be particularly important because it leads to enhanced non-linear interactions and a spectrum that changes in time according to the theory of [[Hasselmann 1966]]. | ||
| + | |||
| + | == Generation of Waves by Wind == | ||
| + | We have seen in the last few paragraphs that waves are related to the wind. We have, however, put off until now just how they are generated by the wind. Suppose we begin with a mirror-smooth sea (Beaufort Number 0). What happens if the wind suddenly begins to blow steadily at say 8m/s? Three different physical processes begin: | ||
| − | + | # The turbulence in the wind produces random pressure fluctuations at the sea surface, which produces small waves with wavelengths of a few centimeters ([[Phillips 1957]]). | |
| + | # Next, the wind acts on the small waves, causing them to become larger. Wind blowing over the wave produces pressure differences along the wave profile causing the wave to grow. The process is unstable because, as the wave gets bigger, the pressure differences get bigger, and the wave grows faster. The instability causes the wave to grow exponentially ([[Miles 1957]]). | ||
| + | # Finally, the waves begin to interact among themselves to produce longer waves ([[Hasselmann et al. 1973]]). The interaction transfers wave energy from short waves generated by Miles mechanism to waves with frequencies slightly lower than the frequency of waves at the peak of the spectrum. Eventually, this leads to waves going faster than the wind, as noted by Pierson and Moskowitz. | ||
| − | + | ==Acknowledgement== | |
| − | + | The material in this page has been derived from [http://oceanworld.tamu.edu/resources/ocng_textbook/contents.html Introduction to Physical Oceanography] by [[Robert Stewart]]. | |
| − | |||
| − | |||
| − | |||
| − | |||
[[Category:Geophysics]] | [[Category:Geophysics]] | ||
Latest revision as of 20:48, 9 December 2012
Introduction
Ocean waves are produced by the wind. The faster the wind, the longer the wind blows, and the bigger the area over which the wind blows, the bigger the waves. In designing ships or offshore structures we wish to know the biggest waves produced by a given wind speed. Suppose the wind blows at 20m/s for many days over a large area of the North Atlantic. What will be the spectrum of ocean waves at the downwind side of the area?
It is important to realise that the spectra presented in the section are attempts to describe the ocean wave spectra in very special conditions, namely the conditions after a wind with constant velocity has been blowing for a long time. A typical ocean wave spectrum wil be much more complicated and variable. For example it may have two peaks, one from distance swell and the other generated by the local wind.
The concept of a wave spectrum can be quite abstract and is described in Waves and the Concept of a Wave Spectrum
Pierson-Moskowitz Spectrum
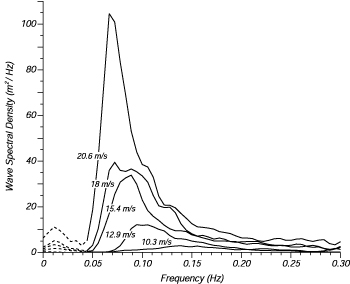
Various idealized spectra are used to answer the question in oceanography and ocean engineering. Perhaps the simplest is that proposed by Pierson and Moskowitz 1964. They assumed that if the wind blew steadily for a long time over a large area, the waves would come into equilibrium with the wind. This is the concept of a fully developed sea (a sea produced by winds blowing steadily over hundreds of miles for several days).Here, a long time is roughly ten-thousand wave periods, and a "large area" is roughly five-thousand wave-lengths on a side.
Figure 1 Wave spectra of a fully developed sea for different wind speeds according to Moskowitz 1964.
To obtain a spectrum of a fully developed sea, they used measurements of waves made by accelerometers on British weather ships in the North Atlantic. First, they selected wave data for times when the wind had blown steadily for long times over large areas of the North Atlantic. Then they calculated the wave spectra for various wind speeds, and they found that the spectra were of the form (Figure 1):
[math]\displaystyle{ S(\omega) = \frac{\alpha g^2}{\omega^5}\exp\left(-\beta\left(\frac{\omega_0}{\omega}\right)^4\right) }[/math]
where [math]\displaystyle{ \omega = 2\pi f }[/math], [math]\displaystyle{ f }[/math] is the wave frequency in Hertz, [math]\displaystyle{ \alpha = 8.1\times 10^{-3} }[/math], [math]\displaystyle{ \beta = 0.74 }[/math], [math]\displaystyle{ \omega_0 = g / U_{19.5} }[/math] and [math]\displaystyle{ U_{19.5} }[/math] is the wind speed at a height of 19.5m above the sea surface, the height of the anemometers on the weather ships used by Pierson and Moskowitz 1964.
For most air flow over the sea the atmospheric boundary layer has nearly neutral stability, and
[math]\displaystyle{ U_{19.5}\approx 1.026 U_{10} }[/math]
assuming a drag coefficient of [math]\displaystyle{ 1.3 \times 10^{-3} }[/math].
The frequency of the peak of the Pierson-Moskowitz spectrum is calculated by solving [math]\displaystyle{ dS / d\omega = 0 }[/math] for [math]\displaystyle{ \omega_p }[/math], to obtain
[math]\displaystyle{ \omega_p = 0.877 g / U_{19.5}\,\! }[/math]
The speed of waves at the peak is calculated from (16.10), which gives:
Hence waves with frequency [math]\displaystyle{ \omega_p }[/math] travel 14% faster than the wind at a height of 19.5m or 17% faster than the wind at a height of 10m. This poses a difficult problem: How can the wind produce waves traveling faster than the wind? We will return to the problem after we discuss the JONSWAP spectrum and the influence of nonlinear interactions among wind-generated waves.
The significant wave-height is calculated from the integral of [math]\displaystyle{ S\mbox{ }(\omega) }[/math] to obtain:
[math]\displaystyle{ \left \langle \zeta^2\right \rangle=\int_{0}^{\infty}S(\omega)\mbox{ }\mathrm{d}\omega=2.74 \times 10^{-3}\frac{(U_{10.5})^4}{g^2} }[/math]
Remembering that [math]\displaystyle{ H_{1/3} = 4\mbox{ }\lt \mbox{ }\zeta^2 \mbox{ }\gt \mbox{ }^{1/2} }[/math], the significant wave-height calculated from the Pierson-Moskowitz spectrum is:
[math]\displaystyle{ H_{1/3}=0.21\frac{(U_{19.5})^2}{g}\approx0.22\frac{(U_{10})^2}{g} }[/math]
Practical wave analysis of uses the frequency, [math]\displaystyle{ f }[/math], instead of the angular frequency [math]\displaystyle{ \omega }[/math]. If we have a frequency spectrum, [math]\displaystyle{ S(\omega) }[/math], then the corresponding frequency spectrum, [math]\displaystyle{ S'(f) }[/math], will be
(the factor of [math]\displaystyle{ 2\pi }[/math] insures that the area under the curve remains the same).
In the following we omit the ' symbol. For practical reasons, it has also become standard to relate the variables to the main sea state parameters rather than wind speed, and to use slightly different values so that the Pierson-Moskowitz spectrum can be expressed as
[math]\displaystyle{ S(f) = \alpha g^2(2\pi)^{-4}f^{-5}\exp\left(-\frac{5}{4}\left(\frac{f_m}{f}\right)^4\right) }[/math]
where [math]\displaystyle{ \alpha }[/math] is Phillips constant and [math]\displaystyle{ f_m }[/math] is the peak frequency. Remember that these expressions are an approximation to the real sea spectrum.
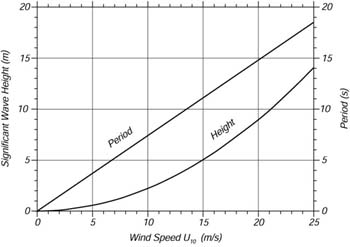
Figure 2 gives significant wave-heights and periods calculated from the Pierson-Moskowitz spectrum.
Figure 2 Significant wave-height and period at the peak of the spectrum of a fully developed sea calculated from the Pierson-Moskowitz spectrum.
JONSWAP Spectrum
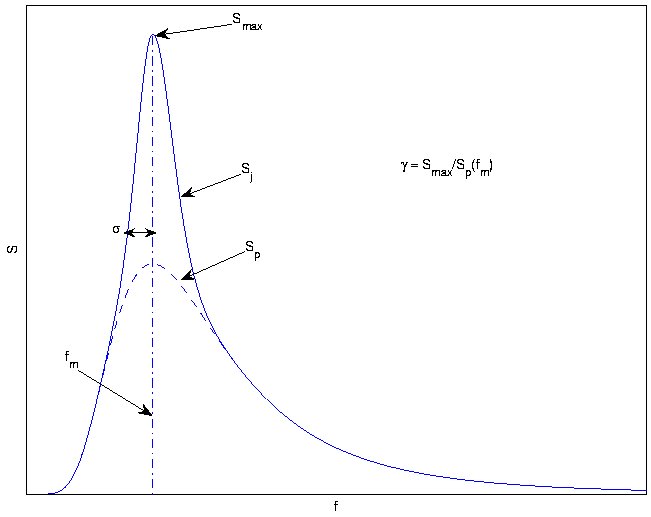
Hasselmann et al. 1973, after analyzing data collected during the Joint North Sea Wave Observation Project JONSWAP, found that the wave spectrum is never fully developed. It continues to develop through non-linear, wave-wave interactions even for very long times and distances. Hence an extra and somewhat artificial factor was added to the Pierson-Moskowitz spectrum in order to improve the fit to their measurements. The JONSWAP spectrum is thus a Pierson-Moskowitz spectrum multiplied by an extra peak enhancement factor [math]\displaystyle{ \gamma^r }[/math]
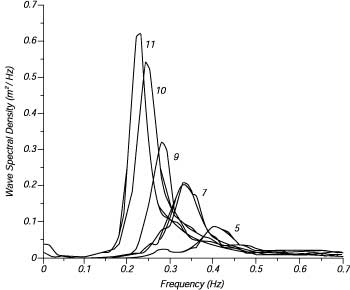
Figure 3 Wave spectra of a developing sea for different fetches according to Hasselmann et al. 1973.
Figure 3 show wave spectra as mearured from {[Hasselmann et al. 1973]] and Figure 4 shows a comparison of the JONSWAP and Pierson-Moskowitz spectra.
Figure 4 The JONSWAP and Pierson-Moskowitz spectra.
Wave data collected during the JONSWAP experiment were used to determine the values for the constants in the above equations:
- [math]\displaystyle{ \alpha=0.076\left(\frac{U_{10}^2}{F\mbox{ }g}\right)^{0.22} }[/math]
- [math]\displaystyle{ \omega_p=22\left(\frac{g^2}{U_{10}F}\right)^{1/3} }[/math]
- [math]\displaystyle{ \gamma = 3.3 \,\! }[/math]
- [math]\displaystyle{ \sigma = \begin{cases} 0.07 & \omega \le \omega_p \\ 0.09 & \omega \gt \omega_p \end{cases} }[/math]
where [math]\displaystyle{ F }[/math] is the distance from a lee shore, called the fetch, or the distance over which the wind blows with constant velocity.
The energy of the waves increases with fetch:
The JONSWAP spectrum is similar to the Pierson-Moskowitz spectrum except that waves continues to grow with distance (or time) as specified by the a term, and the peak in the spectrum is more pronounced, as specified by the g term. The latter turns out to be particularly important because it leads to enhanced non-linear interactions and a spectrum that changes in time according to the theory of Hasselmann 1966.
Generation of Waves by Wind
We have seen in the last few paragraphs that waves are related to the wind. We have, however, put off until now just how they are generated by the wind. Suppose we begin with a mirror-smooth sea (Beaufort Number 0). What happens if the wind suddenly begins to blow steadily at say 8m/s? Three different physical processes begin:
- The turbulence in the wind produces random pressure fluctuations at the sea surface, which produces small waves with wavelengths of a few centimeters (Phillips 1957).
- Next, the wind acts on the small waves, causing them to become larger. Wind blowing over the wave produces pressure differences along the wave profile causing the wave to grow. The process is unstable because, as the wave gets bigger, the pressure differences get bigger, and the wave grows faster. The instability causes the wave to grow exponentially (Miles 1957).
- Finally, the waves begin to interact among themselves to produce longer waves (Hasselmann et al. 1973). The interaction transfers wave energy from short waves generated by Miles mechanism to waves with frequencies slightly lower than the frequency of waves at the peak of the spectrum. Eventually, this leads to waves going faster than the wind, as noted by Pierson and Moskowitz.
Acknowledgement
The material in this page has been derived from Introduction to Physical Oceanography by Robert Stewart.


